The GenerIA Blog
Telemetry, an essential component of the best AIs
Extensive telemetry brings a great deal to enterprise artificial intelligence. Performance, behavior, response biases, prompt injections... Everything that can be observed contributes to continuous optimization, thereby guaranteeing the full success of AI projects.
By combining the automated collection of metrics, messages and functional descriptors, today's telemetry represents a holistic approach to systems monitoring. Far from being limited to a simple aggregation of performance metrics or event logs, it extends to execution traces, usage statistics and infrastructure status, forming a 360° picture of applications health and operation.
In today's digital environments, these applications, including enterprise artificial intelligences, are becoming increasingly sophisticated and distributed. Telemetry is accordingly no longer an option, but an absolute necessity. The advent of containerized or multi/micro-services architectures and the variety of deployment strategies (on-premise, in the cloud or any combination of both) are creating ecosystems where traditional visibility is no longer enough. Telemetry responds to this new situation by providing a clear, detailed view of complex processes.
Four transformative impacts
Observability is perhaps the most immediate benefit of modern telemetry. It enables technical teams to maintain continuous monitoring of the applications they are responsible for, with a breadth of coverage that extends far beyond the simple detection of faults or malfunctions. With this kind of automatic observation capability, problems can often be identified before they occur and have an impact on end-users. This shift from reactive to proactive-in-real-life-conditions is critical for everyone involved in a system's lifecycle.
Optimizing quantitative and qualitative performance is another tangible benefit of telemetry. By analyzing the data collected, we can precisely identify the impacting factors specific to a given application. For AI, this could be the number of repetition rounds in a conversation, the quality of predictions or the number of responses evaluated as relevant in a RAG pipeline, the queries or functionalities that used more often than others, etc. The dimensions are numerous and specific to each type of AI. In addition, by systematically monitoring model outputs, we can detect certain biases in the results or performance degradations on certain types of data ("model drift monitoring"). This understanding enables functional optimization based on concrete data, which is very useful for directing improvement efforts and measuring incremental progress.
Safety is also enhanced by a well-implemented telemetry. Rapidly detecting suspicious behaviors (such as prompt injections) and facilitating forensic or post-mortem analysis brings a major efficiency gain in a context where security threats are increasingly numerous, diverse and technically sophisticated. It should also be noted that the data collected contributes by nature to control audits and compliance procedures, a crucial aspect for many organizations.
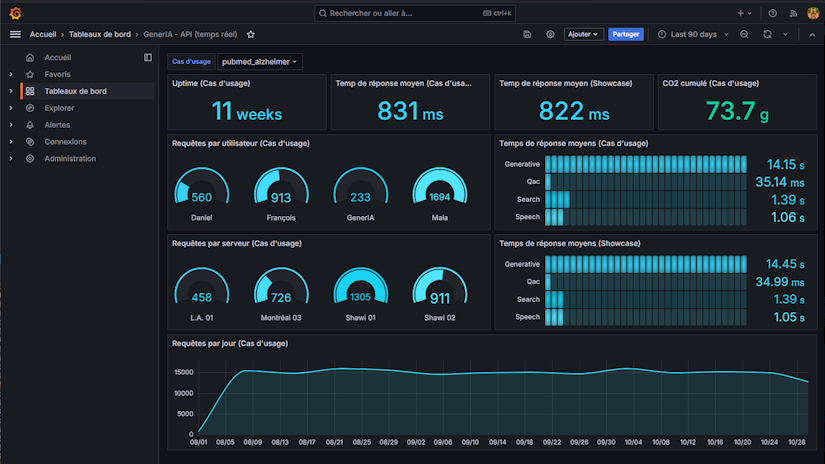
Last but not least, telemetry also provides non-technicians with application management elements that help them better fulfill their mission. GenerIA AIs, for example, offer CO2 and API dashboards, i.e. real-time graphical representations (curves, histograms, doughnuts, etc.) of energy consumption, CO2 emissions, server loads and so on. These visualizations, infinitely configurable in just a few clicks, are immediately understandable. They enable teams to monitor trends, provision resources and almost automatically fill in the internal or regulatory reports they are required to produce.
OpenTelemetry: durability and flexibility
GenerIA has chosen OpenTelemetry to implement all its telemetry services. Why OpenTelemetry? Because, unlike proprietary or Open Source solutions currently available, “Otel” (as it is called in the community) is designed from the outset to standardize the collection, processing and export of telemetry data.
This standardization solves one of the major problems in the field: the fragmentation of practices and tools. By offering a unified format for metrics, traces and logs, OpenTelemetry considerably simplifies the integration of this treasure trove of information, and multiplies the uses to which it can be put. On the implementation side, by offering APIs and SDKs for the main languages (C++, Rust, Go, Python, Erlang, Java, Javascript, Swift...) as well as native connectors for numerous backends (Prometheus, Jaeger, Zipkin...), OpenTelemetry enables gradual, non-disruptive adoption in the vast majority of existing enterprise environments.
As proof of OpenTelemetry's incomparable flexibility, the list of third-party solutions capable of natively consuming its data includes 74 names to date, from the usual suspects (GCP, Oracle, Azure...) to the most specialized (ClickHouse, Sentry, Splunk...). These solutions range from persistence and visualization to analysis and real-time alerts. Further testimony to the vitality of this ecosystem, the data collector, OpenTelemetry's core component, is also available in a "Contrib" version. This Open Source GitHub repository (Apache 2.0 license) enables third-party vendors to add connectors to their products to the standard data collector, enabling them to evolve together without technical debt. Otel Contrib is published under the aegis of the OpenTelemetry team itself, so all quality guarantees are there. For good measure, OpenTelemetry is a CNCF project (Cloud Native Computing Foundation), a non-profit organization member of the Linux Foundation . There's probably no better assurance of seriousness and sustainability.
GenerIA AIs: totally telemastered
For GenerIA and our clients, this approach to telemetry warrants operational performance and ease of integration. All GenerIA AIs include their own complete, configurable telemetry right from the outset, with data visible only to the client. Collection, persistence, visualization... each component is containerized and can be directly replaced by another if a particular vendor or technology is preferred. When GenerIA AIs need to be integrated into solutions that already include all or some of the elements required for telemetry, the multiplicity of compatible languages and connectors to existing systems makes it easy to combine the qualities of each stakeholder.
In concrete terms, this means, for example, that an application connected to a customized GenerIA AI will be able to exchange OpenTelemetry data in its original language (or even without programming, as Otel offers a highly efficient “No Code” implementation for the automatic tracing of exchanges). As another example, almost any existing log storage and analysis infrastructure will be able to consume GenerIA telemetry data directly, without any additional processing or cost. Finally, an organization already using a management platform can directly visualize GenerIA telemetry data in its own dashboards, and integrate this data into its reports. It's that simple.
Conclusion
Telemetry is undoubtedly essential to a high-performance AI solution. But, perhaps more than that, it is also a factor in overall project success. Knowing how AI is really used allows to fine-tune its skills, interface and security. Knowing how much it really costs on a daily basis allows to optimize budgets, resources and applications. Knowing how much CO2 it really emits, especially in the case of frugal AI such as GenerIA's, allows it to be totally decarbonized.
In the GenerIA blog:


