100 % Eco-transparent AI Solutions
In keeping with our Environmental commitments and building on the advanced frugality of our technologies, GenerIA products and solutions include all the tools you need to monitor and steer your environmental performance in real time.
With granular CO2e + water consumption metrics and detailed historical dashboards, you can adapt your use of AI and support your organization's ESG objectives, including its reporting and compliance requirements.
To the best of our knowledge, no other AI provider offers this level of mature and verifiable eco-transparency.
CO2e and water metrics included with every response
Whatever you ask a GenerIA AI solution, the answer will be explainable not only about its subject matter but also about the energy consumed, the greenhouse gases emitted and the water used to generate it.
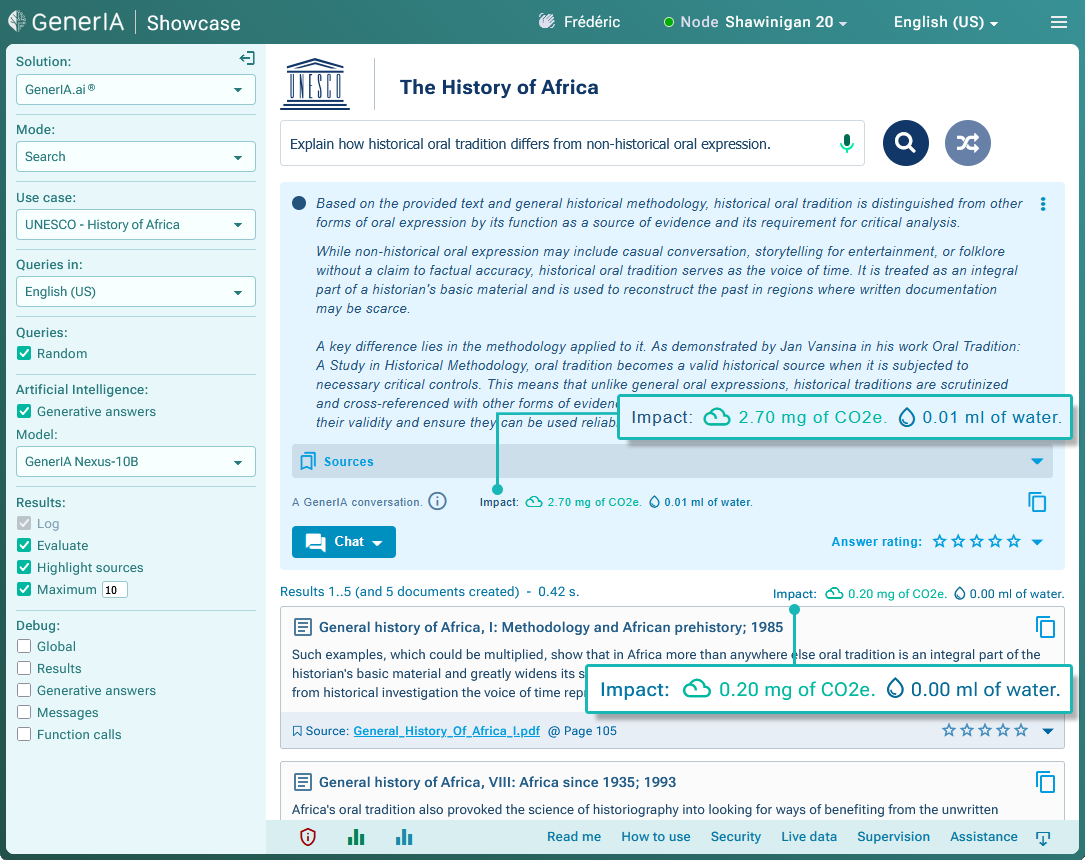
In our RAG systems, CO2e and water metrics are differentiated between the Retrieval and the AI Generation parts of the response to the user question. In the "Chat" mode of the AI widget, metrics are given by conversation turns and cumulated for the whole conversation.
Standardized metrics - These metrics are included in every data payload returned by servers on which GenerIA solutions are deployed. They are expressed in milligrams of CO2e (which accounts for CO2 and other greenhouse gases) and milliliters of water, and are reported to two decimal places. We systematically display these metrics in our demo and customer-facing interfaces. You can do the same when connecting any of your existing applications to a GenerIA AI backend solution.
AFNOR methodologies - The measurements represented by these metrics fully comply with AFNOR Spec 2314, to which we contributed. This specification is the most advanced and rigorous reference framework available today for calculation methodologies and best practices relating to AI's environmental impact. Experts regard it as the only framework that enables accurate and verifiable values to be reported.
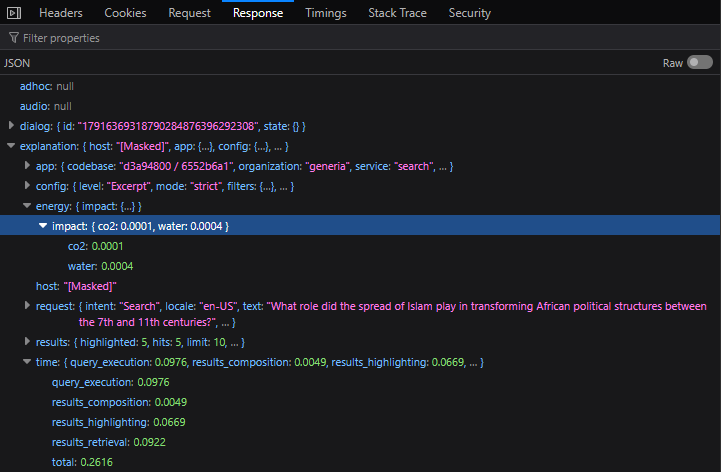
Typical request payload returned from a GenerIA AI application. Environmental impact metrics are included, ready to be displayed in the UI if needed. They are automatically transmitted to your organization's telemetry platform of choice.
Free CO2e and Water dashboards for all your ESG needs
In addition to the energy consumption dashboard described in this website's Frugality technology page, every GenerIA solution comes with two other real time and historical dashboards : one for CO2e emissions, the other for water use. These dashboards provide cumulative insights based on the granular metrics described above.
Fully interactive views - Data can optionally be broken down by solution, team, user, site, service and time period. Each view is interactive: with just a few mouse clicks, you can adjust the level of granularity and the period covered. This allows you to identify precisely which uses generated which environmental impacts.



Industry standards - GenerIA's dashboards come by default as an open source, standards-based observability stack: Grafana visualizations are fed by JSON data recorded in InfluxDB time-series databases via OpenTelemetry flows. Together, these technologies form a consistent, production-ready and future-proof data stack that you can use without additional licensing costs.
Adaptable to your systems - Because this default stack is totally modular, it can be adapted to your organization's existing monitoring architecture:
- OpenTelemetry can be replaced or complemented by the native instrumentation and agents provided by observability platforms such as Datadog, Dynatrace, New Relic, Elastic Observability, Splunk...
- InfluxDB can be replaced by another time-series or telemetry backend, such as Prometheus with Thanos, Grafana Mimir, VictoriaMetrics, TimescaleDB, ClickHouse or Datadog. Trace data can also be stored in a dedicated system such as Grafana Tempo, Jaeger, Elastic or Honeycomb.
- Grafana can be replaced by the visualization and alerting capabilities of Kibana, Datadog, New Relic, Dynatrace... or your organization's existing monitoring console.
How do we do it?
HPC-level technology - Our unique eco-transparency metrics rely on sensors both at hardware and software levels. Most of these sensors are proprietary as we build and optimize our servers and deploy them in locations under our control. They draw on many years of experience in High-Performance Computing (HPC), where energy consumption and its associated effects determine the viability and reliability of large computing systems.
Auditability - Measurements are first recorded then delivered as captured: granularly, in real time, within response payloads and cumulatively through solutions dashboards. They are not altered or adjusted before being presented. This end-to-end traceability guarantees that the underlying data is verifiable and supports independent auditing.
That is what makes the eco-transparency of GenerIA AI solutions genuinely trustworthy.